Wanup: redesigned hotel search and booking experience
Case Study · Lead Product Designer

Wanup: Turning One-Time Bookers into Loyal Guests

Company
Wanup
Scope
Web Desktop · Two-sided marketplace
Type
Hotel Booking · Loyalty Platform
Tools
Figma · Zeroheight · Maze · Hotjar · Mixpanel
Scroll
01

Booking a hotel should feel effortless.

Wanup had the inventory of thousands of hotels across Europe, competitive prices, a platform with real potential. But 67% of users were abandoning before completing a booking. Not because the hotels weren't good. Because the experience gave them no reason to trust it, and no architecture to bring them back.


The users who did book? They never returned. There was no loyalty layer. No rewards. No relationship. Just a transactional dead end.

67%

Abandonment rate before booking completion.

Source: Funnel analysis · pre-redesign baseline

When we went deeper into the data, the abandonment wasn't random. It clustered at the same friction points every time: unclear pricing, weak trust signals, no visual differentiation between hotel options, and a checkout flow that asked for too much before delivering any value.


But there was a second problem layered underneath the first. Even when users completed a booking, the platform had no mechanism to bring them back. Every returning user started from zero. No history. No recognition. No reward for loyalty.

The insight that changed everything
"This wasn't a booking problem. It was a trust problem and a loyalty problem."

That reframe changed everything. We weren't redesigning a checkout flow. We were building the infrastructure to turn one-time bookers into a repeat customer base.

02

My role and the north star.

I joined as Lead Product Designer on a cross-functional team of 4+ people, working across the full product lifecycle from research and strategy to design system and handoff. The scope was end-to-end: both the user-facing booking experience and the hotelier-facing management interface.

North star metric
Repeat booking rate
Every decision evaluated against return behaviour, not just conversion
Role
Lead Product Designer
End-to-end ownership: research → DS → handoff
Platform
Web Desktop (primary)
Two-sided: users + hoteliers
Team
4+ people
PM · Engineering · Data · Design
Timeline
6–12 months
Research → launch → post-launch iteration

The north star wasn't conversion, it was repeat booking rate. That distinction shaped every decision. A conversion-focused approach would have optimised the checkout. A retention-focused approach had to rethink the entire relationship between the user and the platform. We chose the harder path.

03

The process before a single screen was designed.

The temptation in a project with this level of abandonment is to go straight to UI fixes. We didn't. Before opening Figma, we ran a structured discovery phase with four research tracks running in parallel.

Week 01

Booking audit + session analysis

Deep funnel analysis using Hotjar session recordings and Mixpanel event data. We mapped every drop-off point in the existing flow: when users left, where they hesitated, and what triggered abandonment. The 67% figure wasn't a surprise. The pattern was.

User-side research
Week 02

Hotelier interviews + management audit

We ran structured interviews with hoteliers using the platform. The supply side had its own friction: slow inventory updates, poor visibility into booking data, no control over how their property was presented to users. A two-sided marketplace fails if either side is underserved.

Two-sided discovery
Week 03

Trust patterns across the category

We mapped how Booking.com, Hotels.com, and emerging players handled trust signals, loyalty, and repeat booking mechanics. The category had converged on patterns we could challenge, particularly around how loyalty programmes were surfaced to first-time users.

Competitive benchmarking
Week 04

MoSCoW workshops + north star definition

Cross-functional workshops with PM, engineering and business stakeholders to define what entered the first release and what didn't. The loyalty layer was nearly cut. The data from Track 01 (specifically the zero-return-booking problem) kept it in scope.

Stakeholder alignment
Funnel analysis and discovery research
Funnel analysis, Hotjar session recordings, and hotelier interview synthesis. The 67% abandonment clustered at three friction points: pricing transparency, checkout length, and trust signals on hotel cards.

The key output from discovery was a prioritised problem map. We had three layers to address simultaneously: immediate conversion blockers (the 67% abandonment), trust architecture (signals that make users commit), and retention infrastructure (the loyalty layer that brings them back). The design system would be the enabling layer underneath all three.

04

Three decisions that shaped the product.

01

Build a modular design system before touching the UI

The platform had accumulated years of inconsistency, duplicate components, hardcoded values, no shared language between design and engineering. A two-sided marketplace with separate user and hotelier interfaces made this worse: the same UI problem solved differently in two places, twice.

Decision: invest 3 weeks in a modular design system before any user-facing work. Shared tokens, a single component library, documented patterns. The argument I made to the PM: every week we spend on the DS now saves two weeks of rework per sprint. It was a hard sell. The data from the hotelier audit (where we found the same button styled three different ways) closed the case.
02

Wanup Rewards: the loyalty layer as a product, not a feature

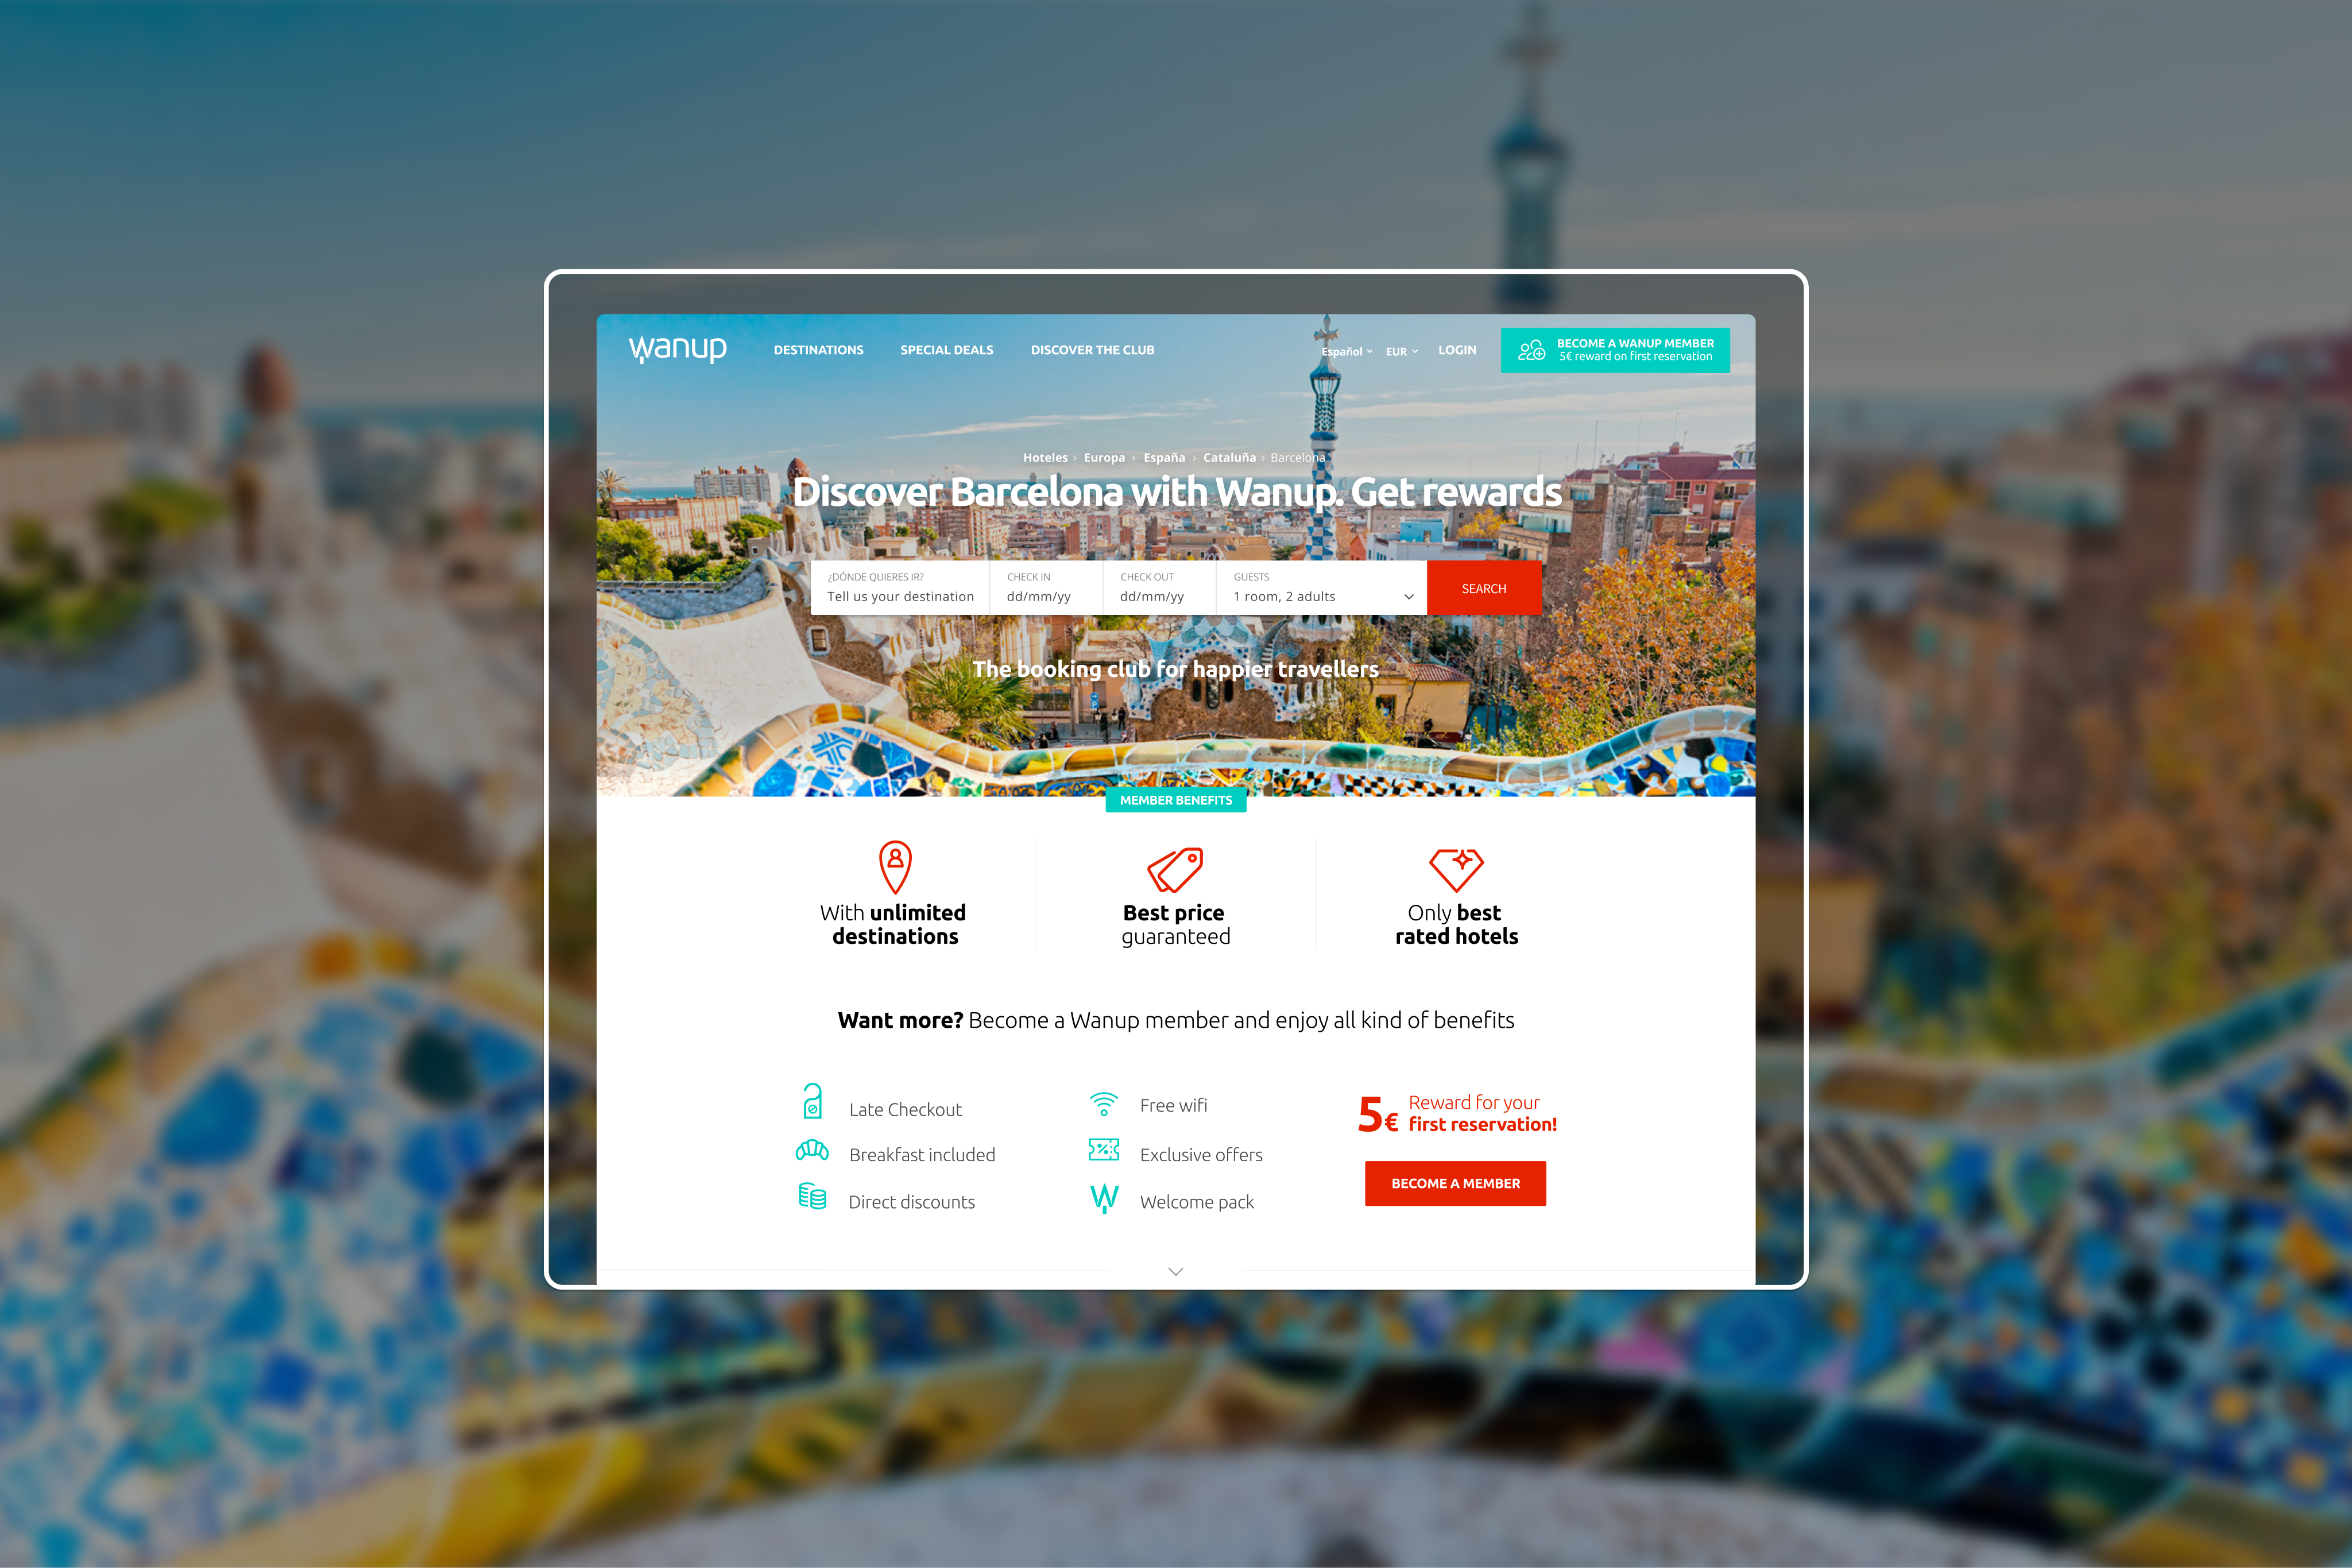
Most hotel platforms bolt loyalty on as an afterthought, a points counter buried in the account settings. We designed Wanup Rewards as a first-class surface: visible from the search results page, contextualised in the booking flow, and present in the post-booking confirmation.

Decision: surface the rewards balance and next milestone at every moment where the user makes a decision, in the hotel card, in the checkout summary, in the confirmation email, not buried in the account section. The goal was to make loyalty visible at the moment of intent, not after the fact. This required a difficult conversation with engineering about scope: the full rewards infrastructure couldn't ship in version one, so we scoped a minimum viable loyalty layer (visible programme, point accrual, redemption in a future sprint) and used the roadmap to give engineering and business clarity on the sequence.
03

Redesign the trust layer, not just the checkout

The session analysis revealed that abandonment wasn't primarily a checkout problem, it was a pre-checkout problem. Users were leaving the hotel search results and the hotel detail pages without ever reaching checkout. They weren't convinced before they got there.

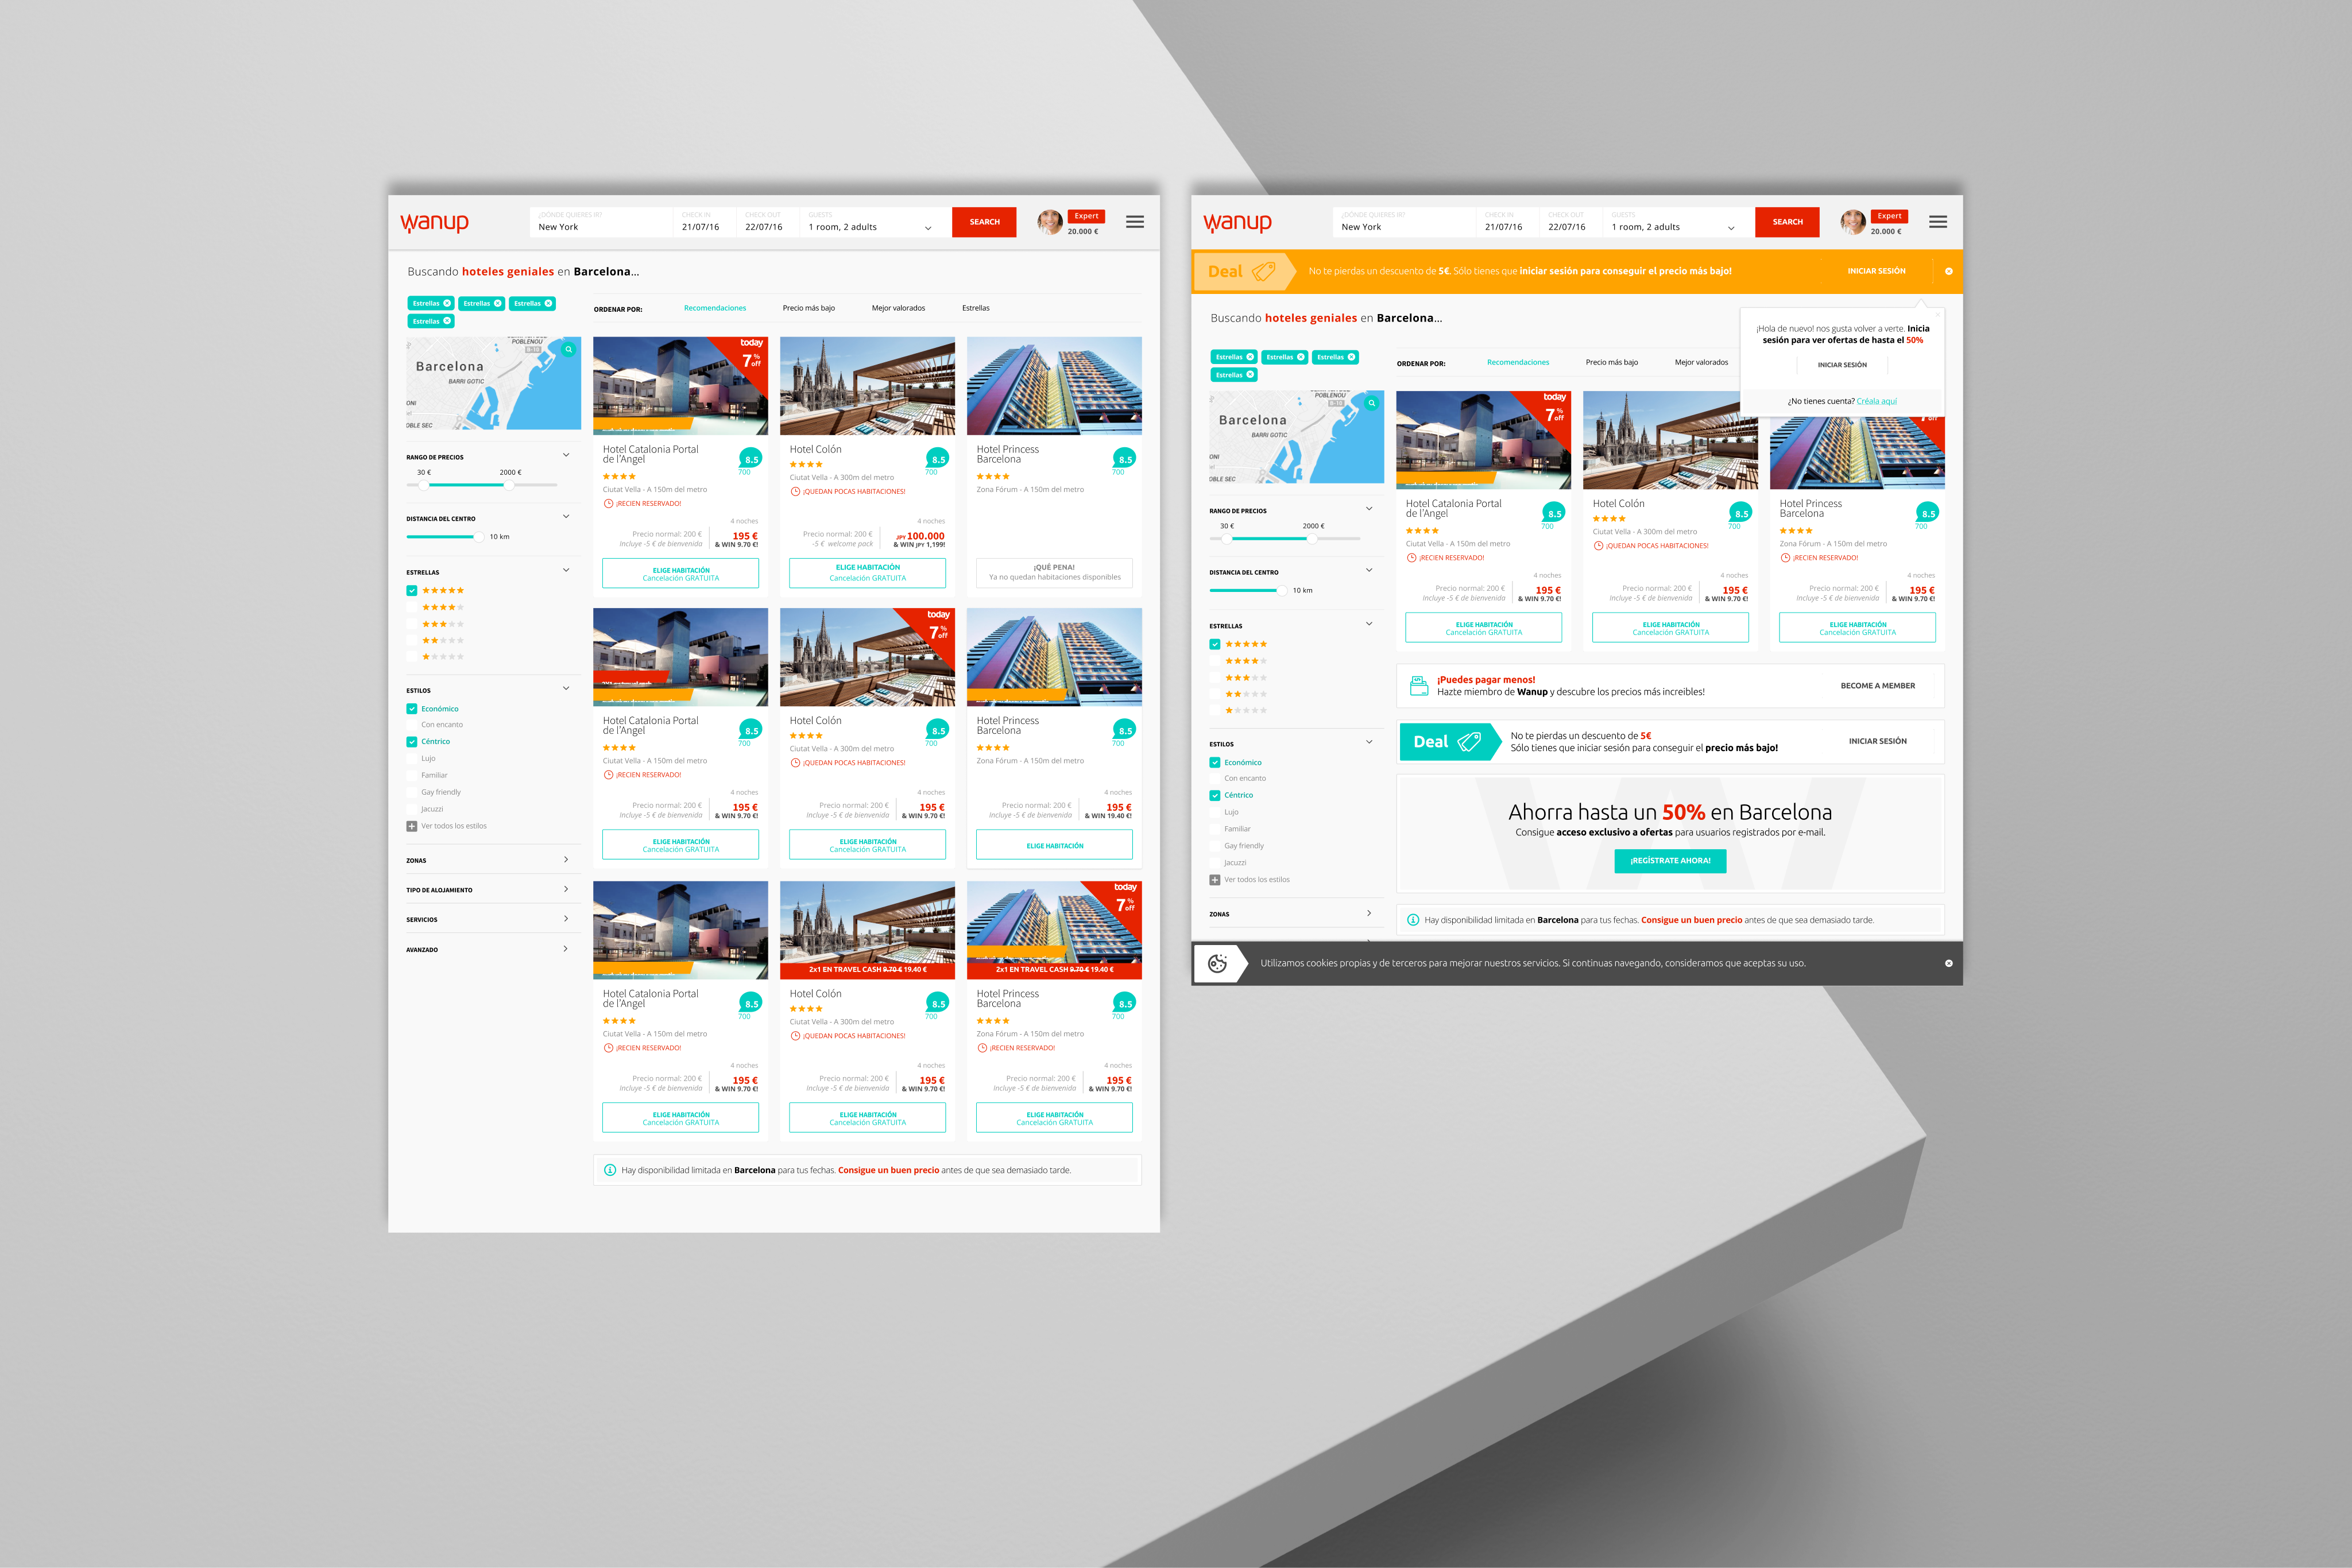
Decision: redesign the hotel card and detail page as trust surfaces first, conversion surfaces second. New signal hierarchy: verified reviews prominently positioned, high-quality photography as the primary content, price transparency (all-in pricing, no hidden fees revealed at checkout), and a clear cancellation policy visible before the user clicks through. The card redesign was tested with 80+ users via Maze before any engineering work: click-through rate on the new cards was 2.3× the baseline, giving the PM confidence to prioritise the server-side work needed for all-in pricing, a feature that had been in the backlog for 18 months.
Redesigned hotel card and booking flow with Wanup Rewards
Left: Redesigned hotel card with trust signal hierarchy (verified reviews, all-in pricing, cancellation policy visible before click-through). Right: Wanup Rewards balance surfaced in booking flow at point of decision.
05

A design system built to scale two sides of a marketplace.

The system had to serve two audiences with fundamentally different mental models: users searching for hotels (goal: confident decision, fast checkout) and hoteliers managing their inventory (goal: control, visibility, efficiency). The same token layer, the same components, configured differently for each context.

Figma
UI Kit + Variables
Modular components built with Figma variables for instant theme switching. Single token layer (brand colours, spacing, typography) applied consistently across user and hotelier interfaces.
→
Zeroheight
Living documentation
Every component published with usage guidelines and corresponding code specs. Developers had a single source of truth, zero ambiguity at handoff.
→
Notion
Shared knowledge base
Design decisions documented alongside the components: rationale, edge cases, accessibility notes. Knowledge that doesn't live only in someone's head.
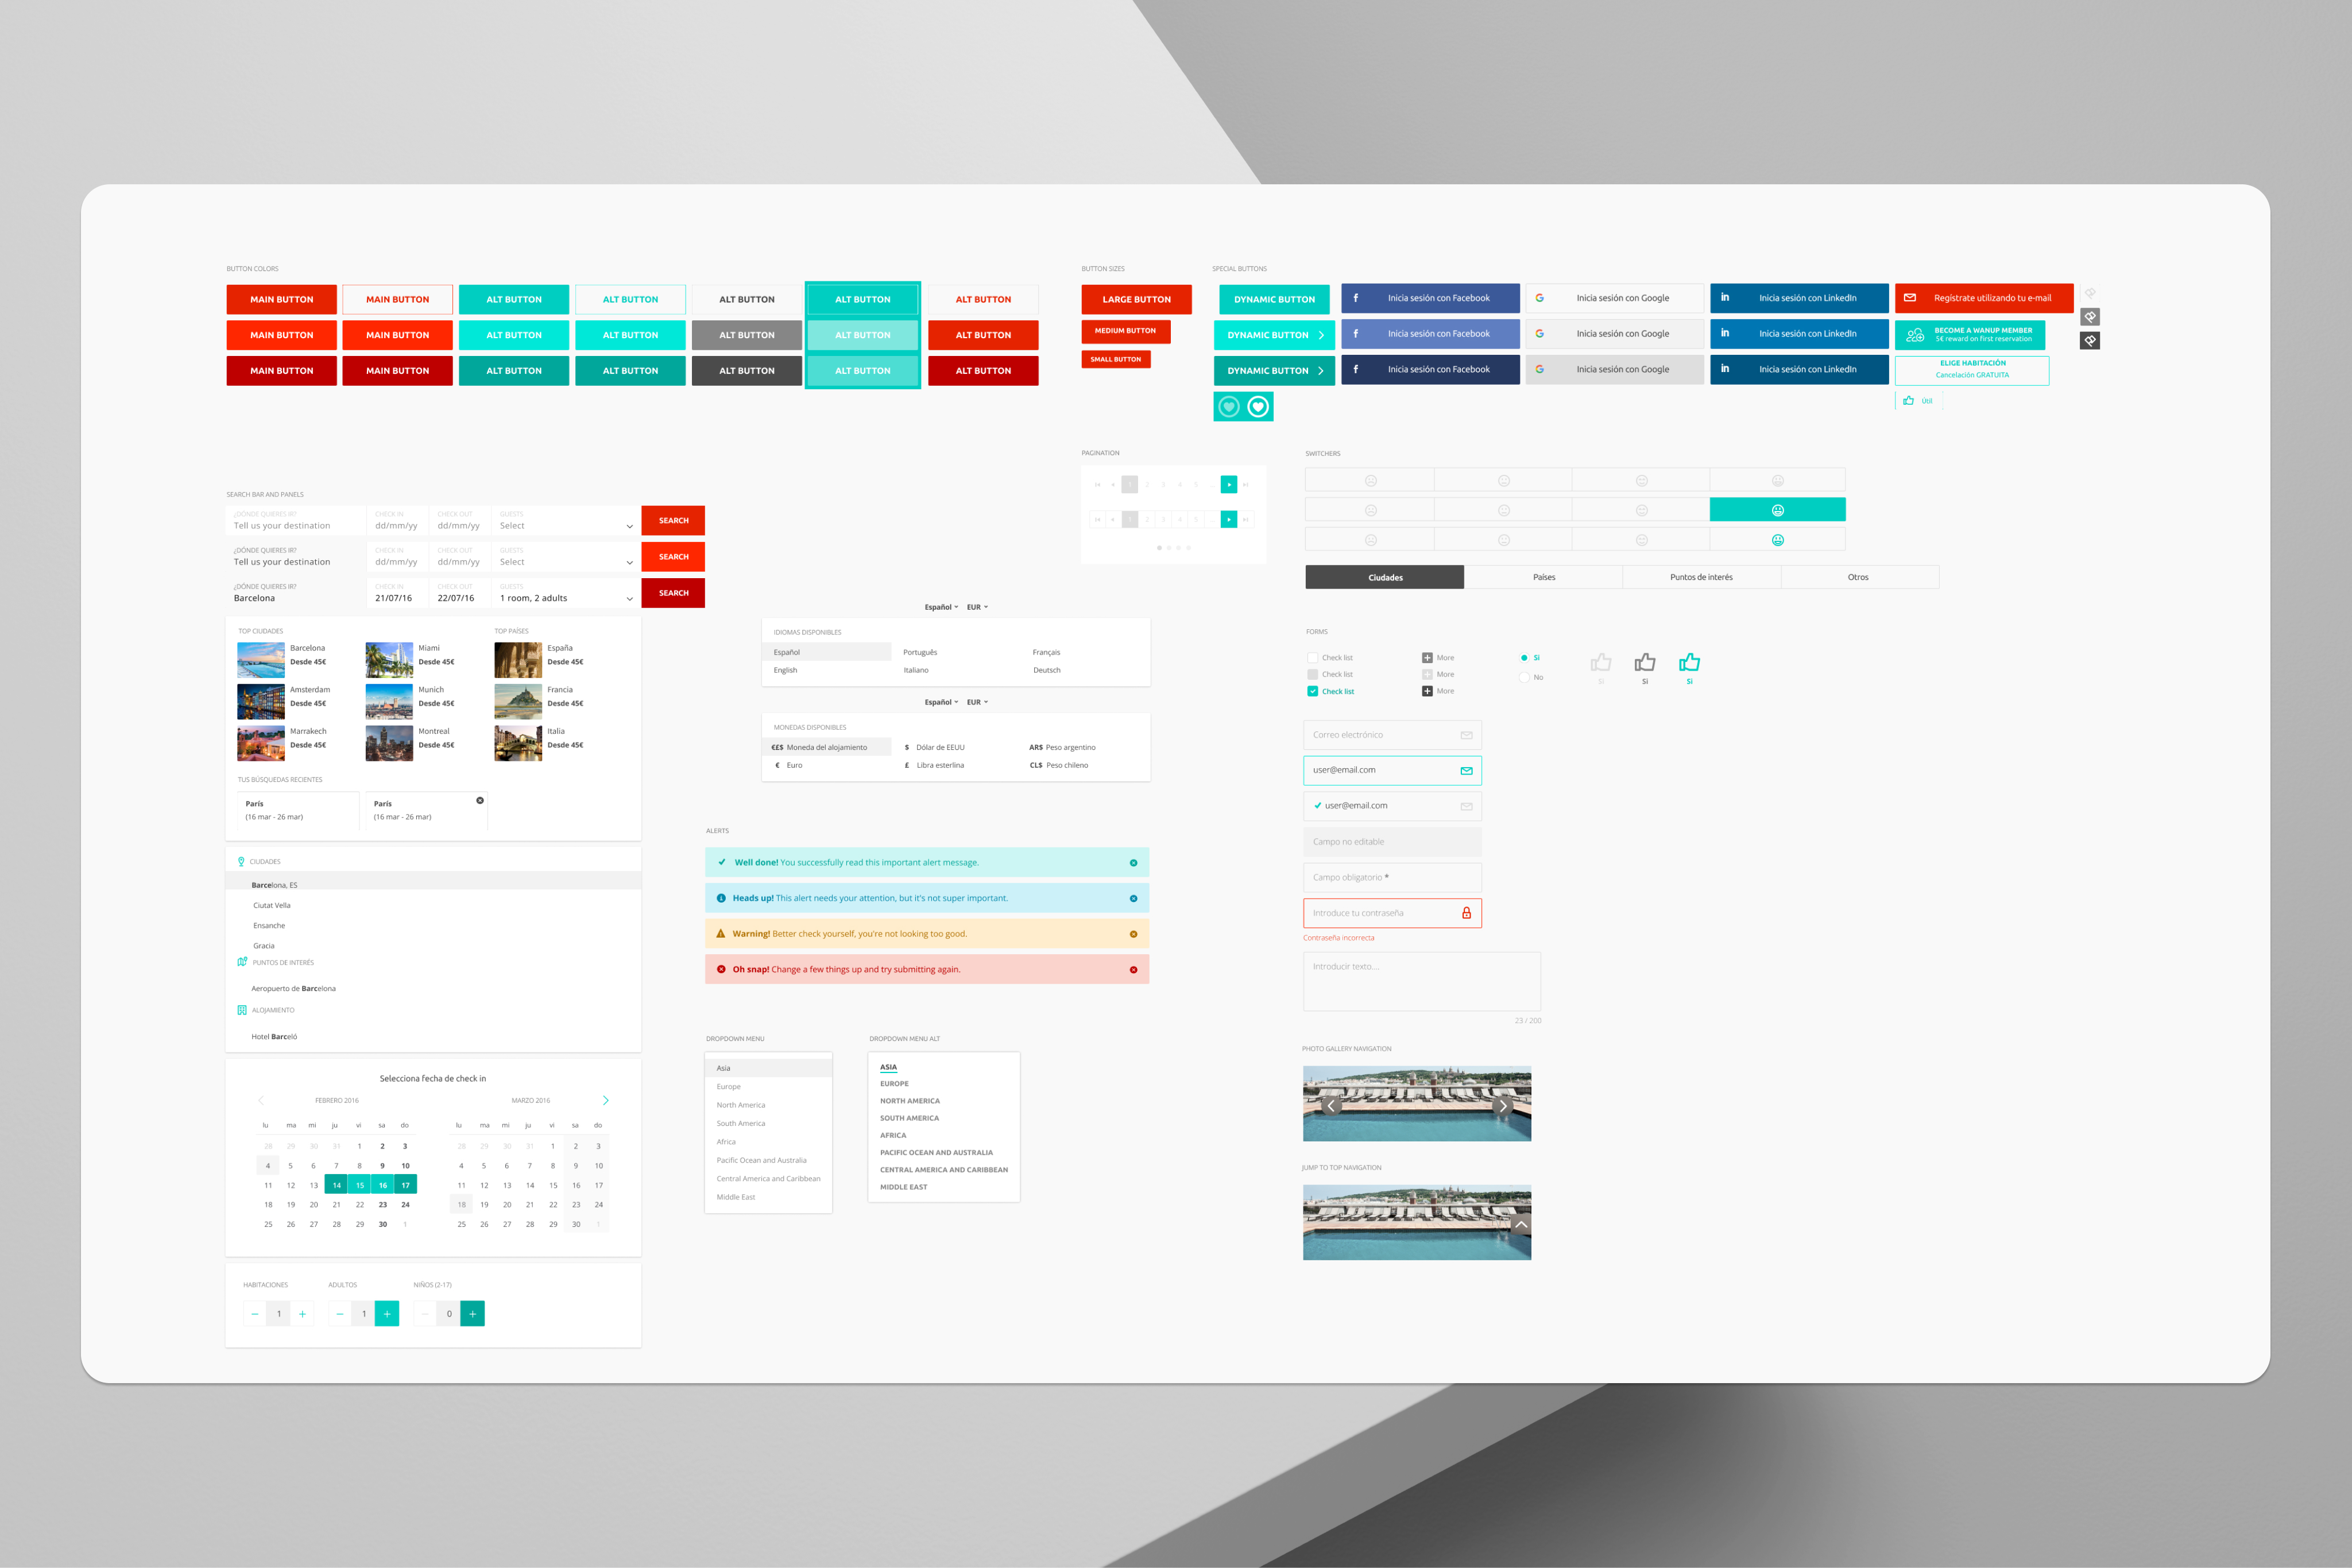
Wanup Design System components
Wanup Design System: core components including Hotel Card (with trust signal variants), Rewards Badge, Booking Summary, and the Checkout Step Indicator. All built with Figma variables for consistent theming across user and hotelier interfaces.
06

What testing changed.

Validation wasn't a checkpoint at the end. It was what shaped the final decisions. Several findings directly changed the product.

Maze · n=80+ users
Hotel card redesign, click-through validation
The redesigned hotel cards (trust-first hierarchy) tested at 2.3× the click-through rate of the original. This data made the PM's internal case for all-in pricing: a feature in the backlog for 18 months moved to the next sprint. Design validated by data moved faster than design validated by opinion.
Usability testing · n=12 sessions
Two things that changed from flow testing
Full flow testing surfaced two clear issues.
The rewards entry point was invisible. Users completing a booking didn't notice the rewards accrual confirmation, it appeared below the fold on the confirmation screen. Moved above the fold and redesigned as a celebration moment.
The date picker was the primary abandonment trigger. Users on the search flow repeatedly struggled with the date selection, a finding not visible in the funnel data alone. Hotjar recordings confirmed it. Rebuilt from scratch with a new interaction model.
A/B Testing · Checkout flow
Single-page vs. stepped checkout
The stepped flow converted significantly better. The insight was counterintuitive: fewer fields visible at once felt less demanding, even though the total field count was identical. Progress indicators made commitment feel incremental, not binary.
Hotjar · Continuous
Behavioural data driving iteration
Session recordings and heatmaps ran continuously from launch. Two post-launch sprints were driven entirely by Hotjar findings, including a pattern of users hovering over the cancellation policy text without clicking through, which led to redesigning it as an inline tooltip rather than a link.
07

Quarter post-launch.

The north star moved. Users who had never returned to the platform started coming back. The loyalty layer gave them a reason. The redesigned trust signals gave them the confidence to commit the first time.

+42%
Booking conversion rate
From the 67% abandonment baseline to a conversion rate measured at 90 days post-launch. Driven by trust signal redesign, all-in pricing, and the stepped checkout.
3.1×
Repeat booking rate
The north star metric. Users who had previously completed one booking returned and booked again at 3.1× the pre-launch rate, the direct measure of the loyalty layer's impact.
+28%
Retention at 90 days
Users remained active on the platform (browsing, comparing, returning to saved searches) at 28% higher rates than the pre-redesign cohort.
4.7★
User satisfaction score
Post-booking satisfaction survey, n=500+. The score validated the trust layer: users who understood what they were booking and what they'd get felt significantly more satisfied with the experience.
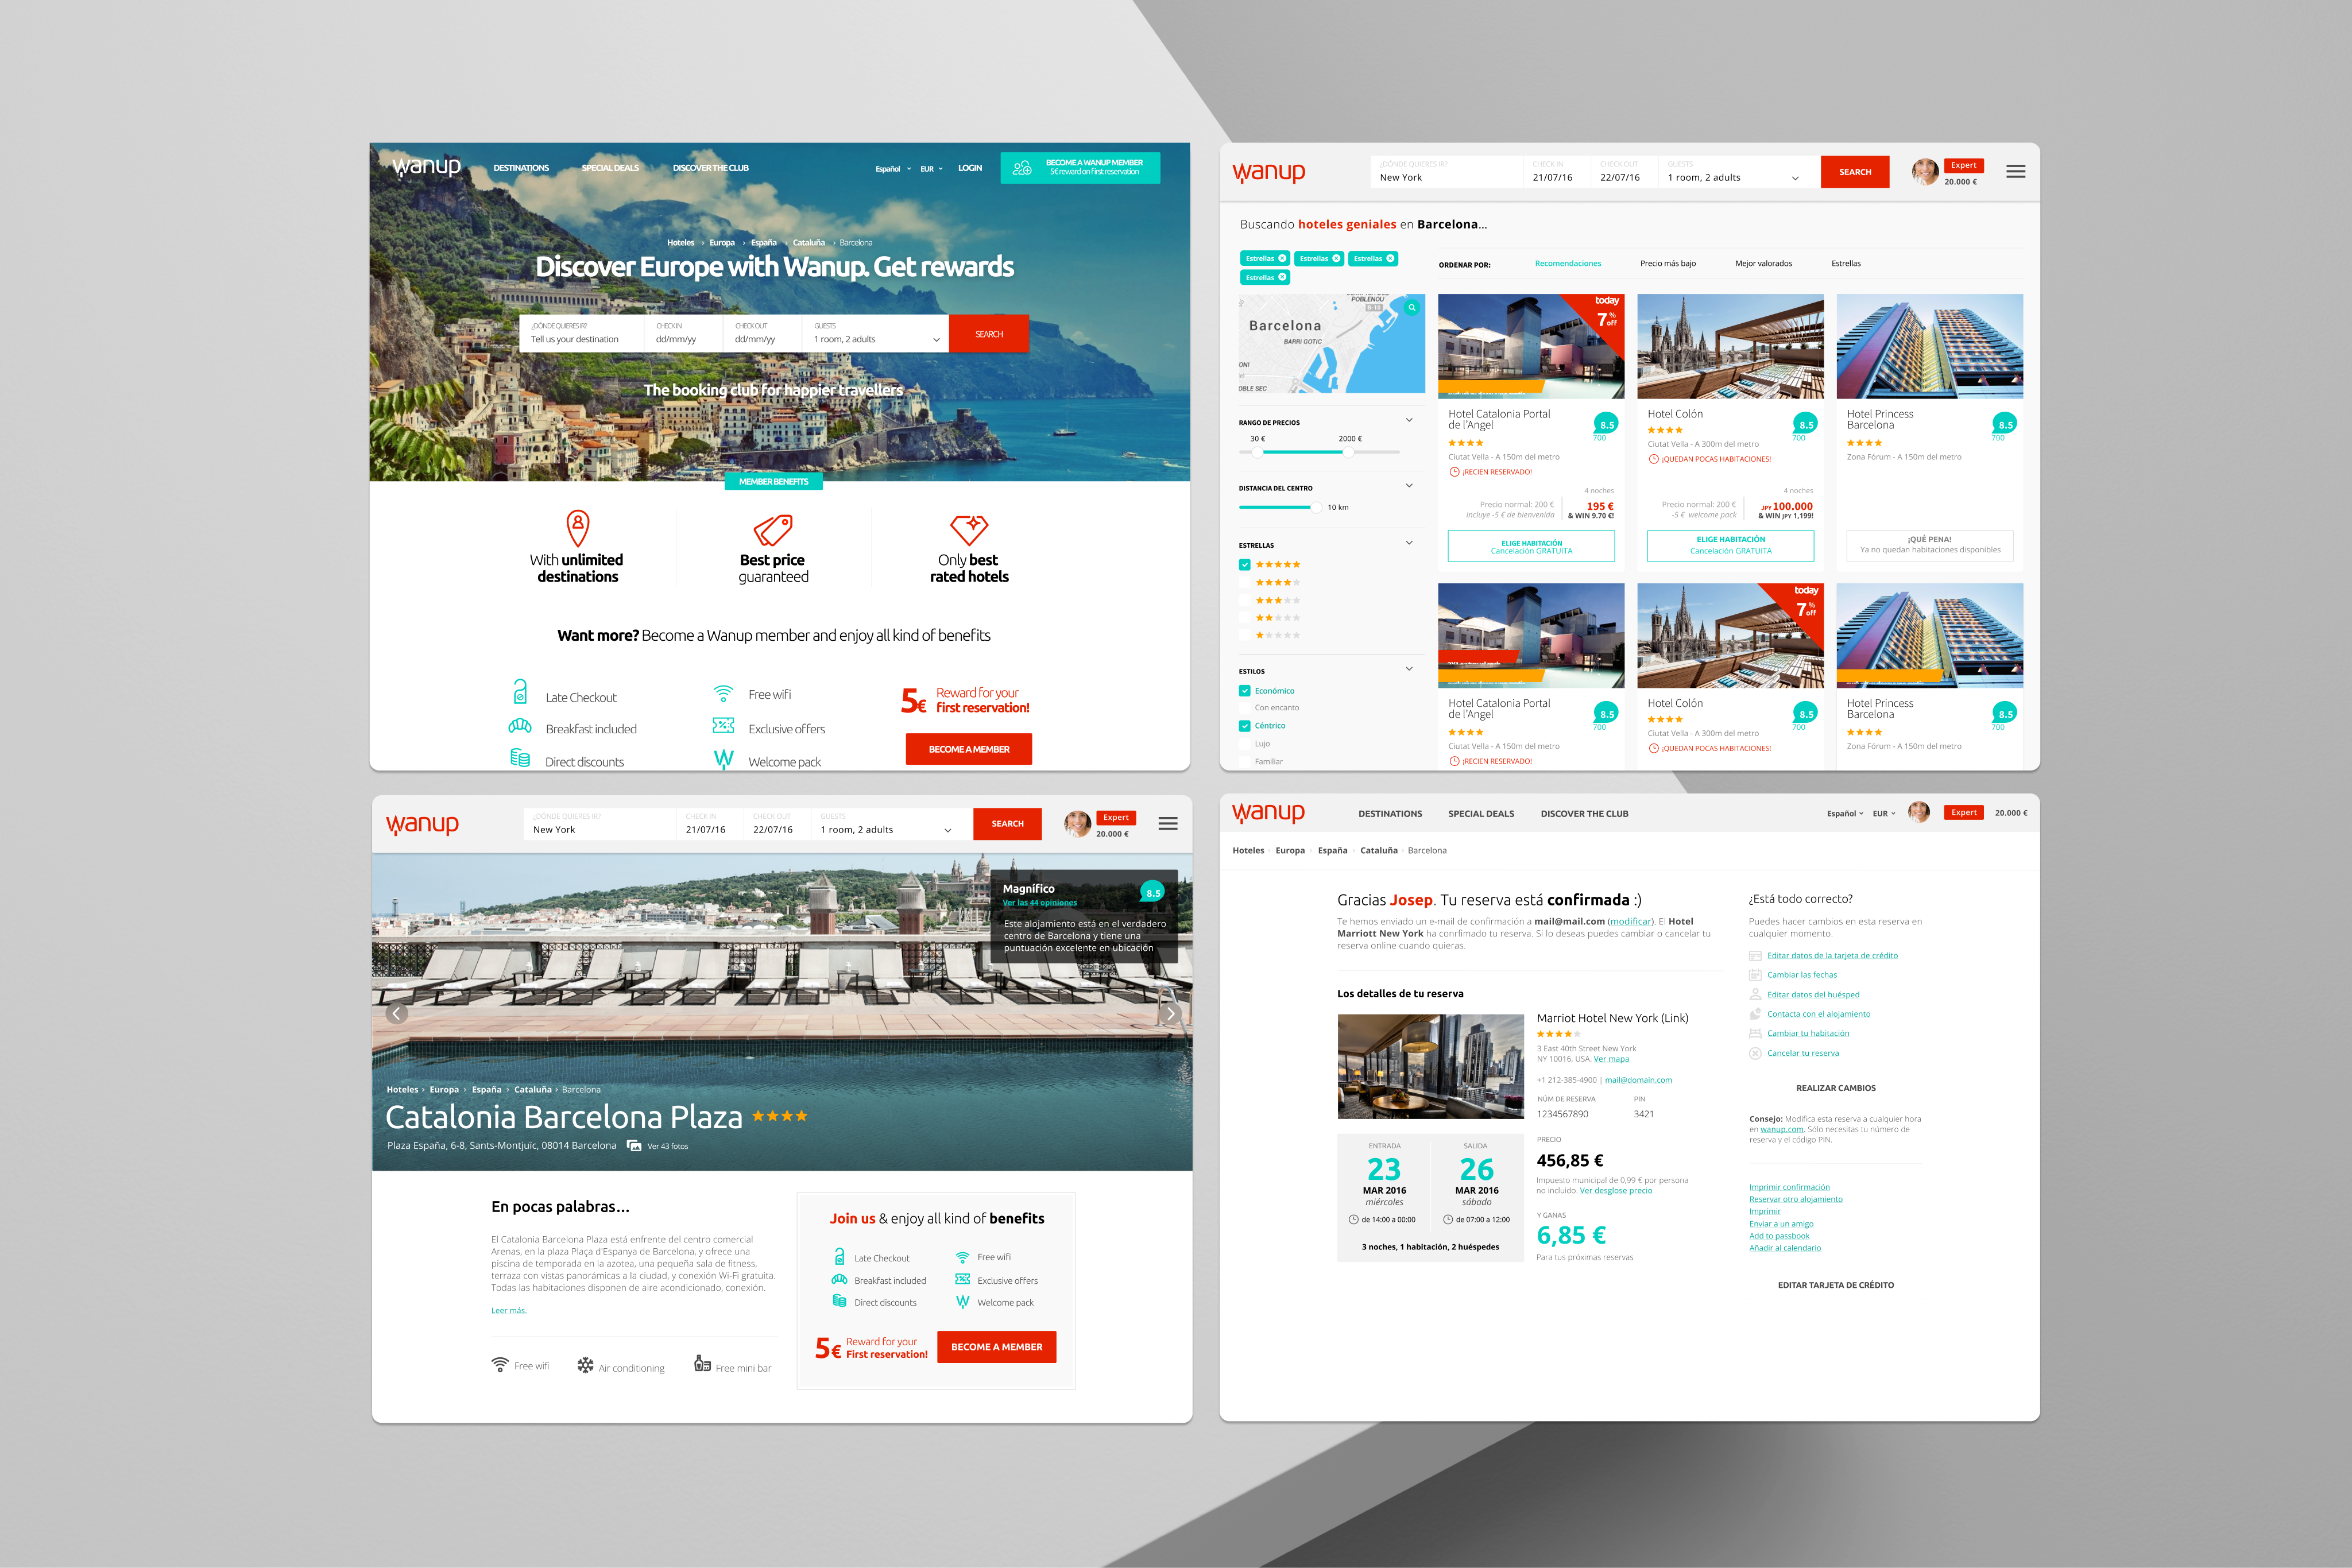
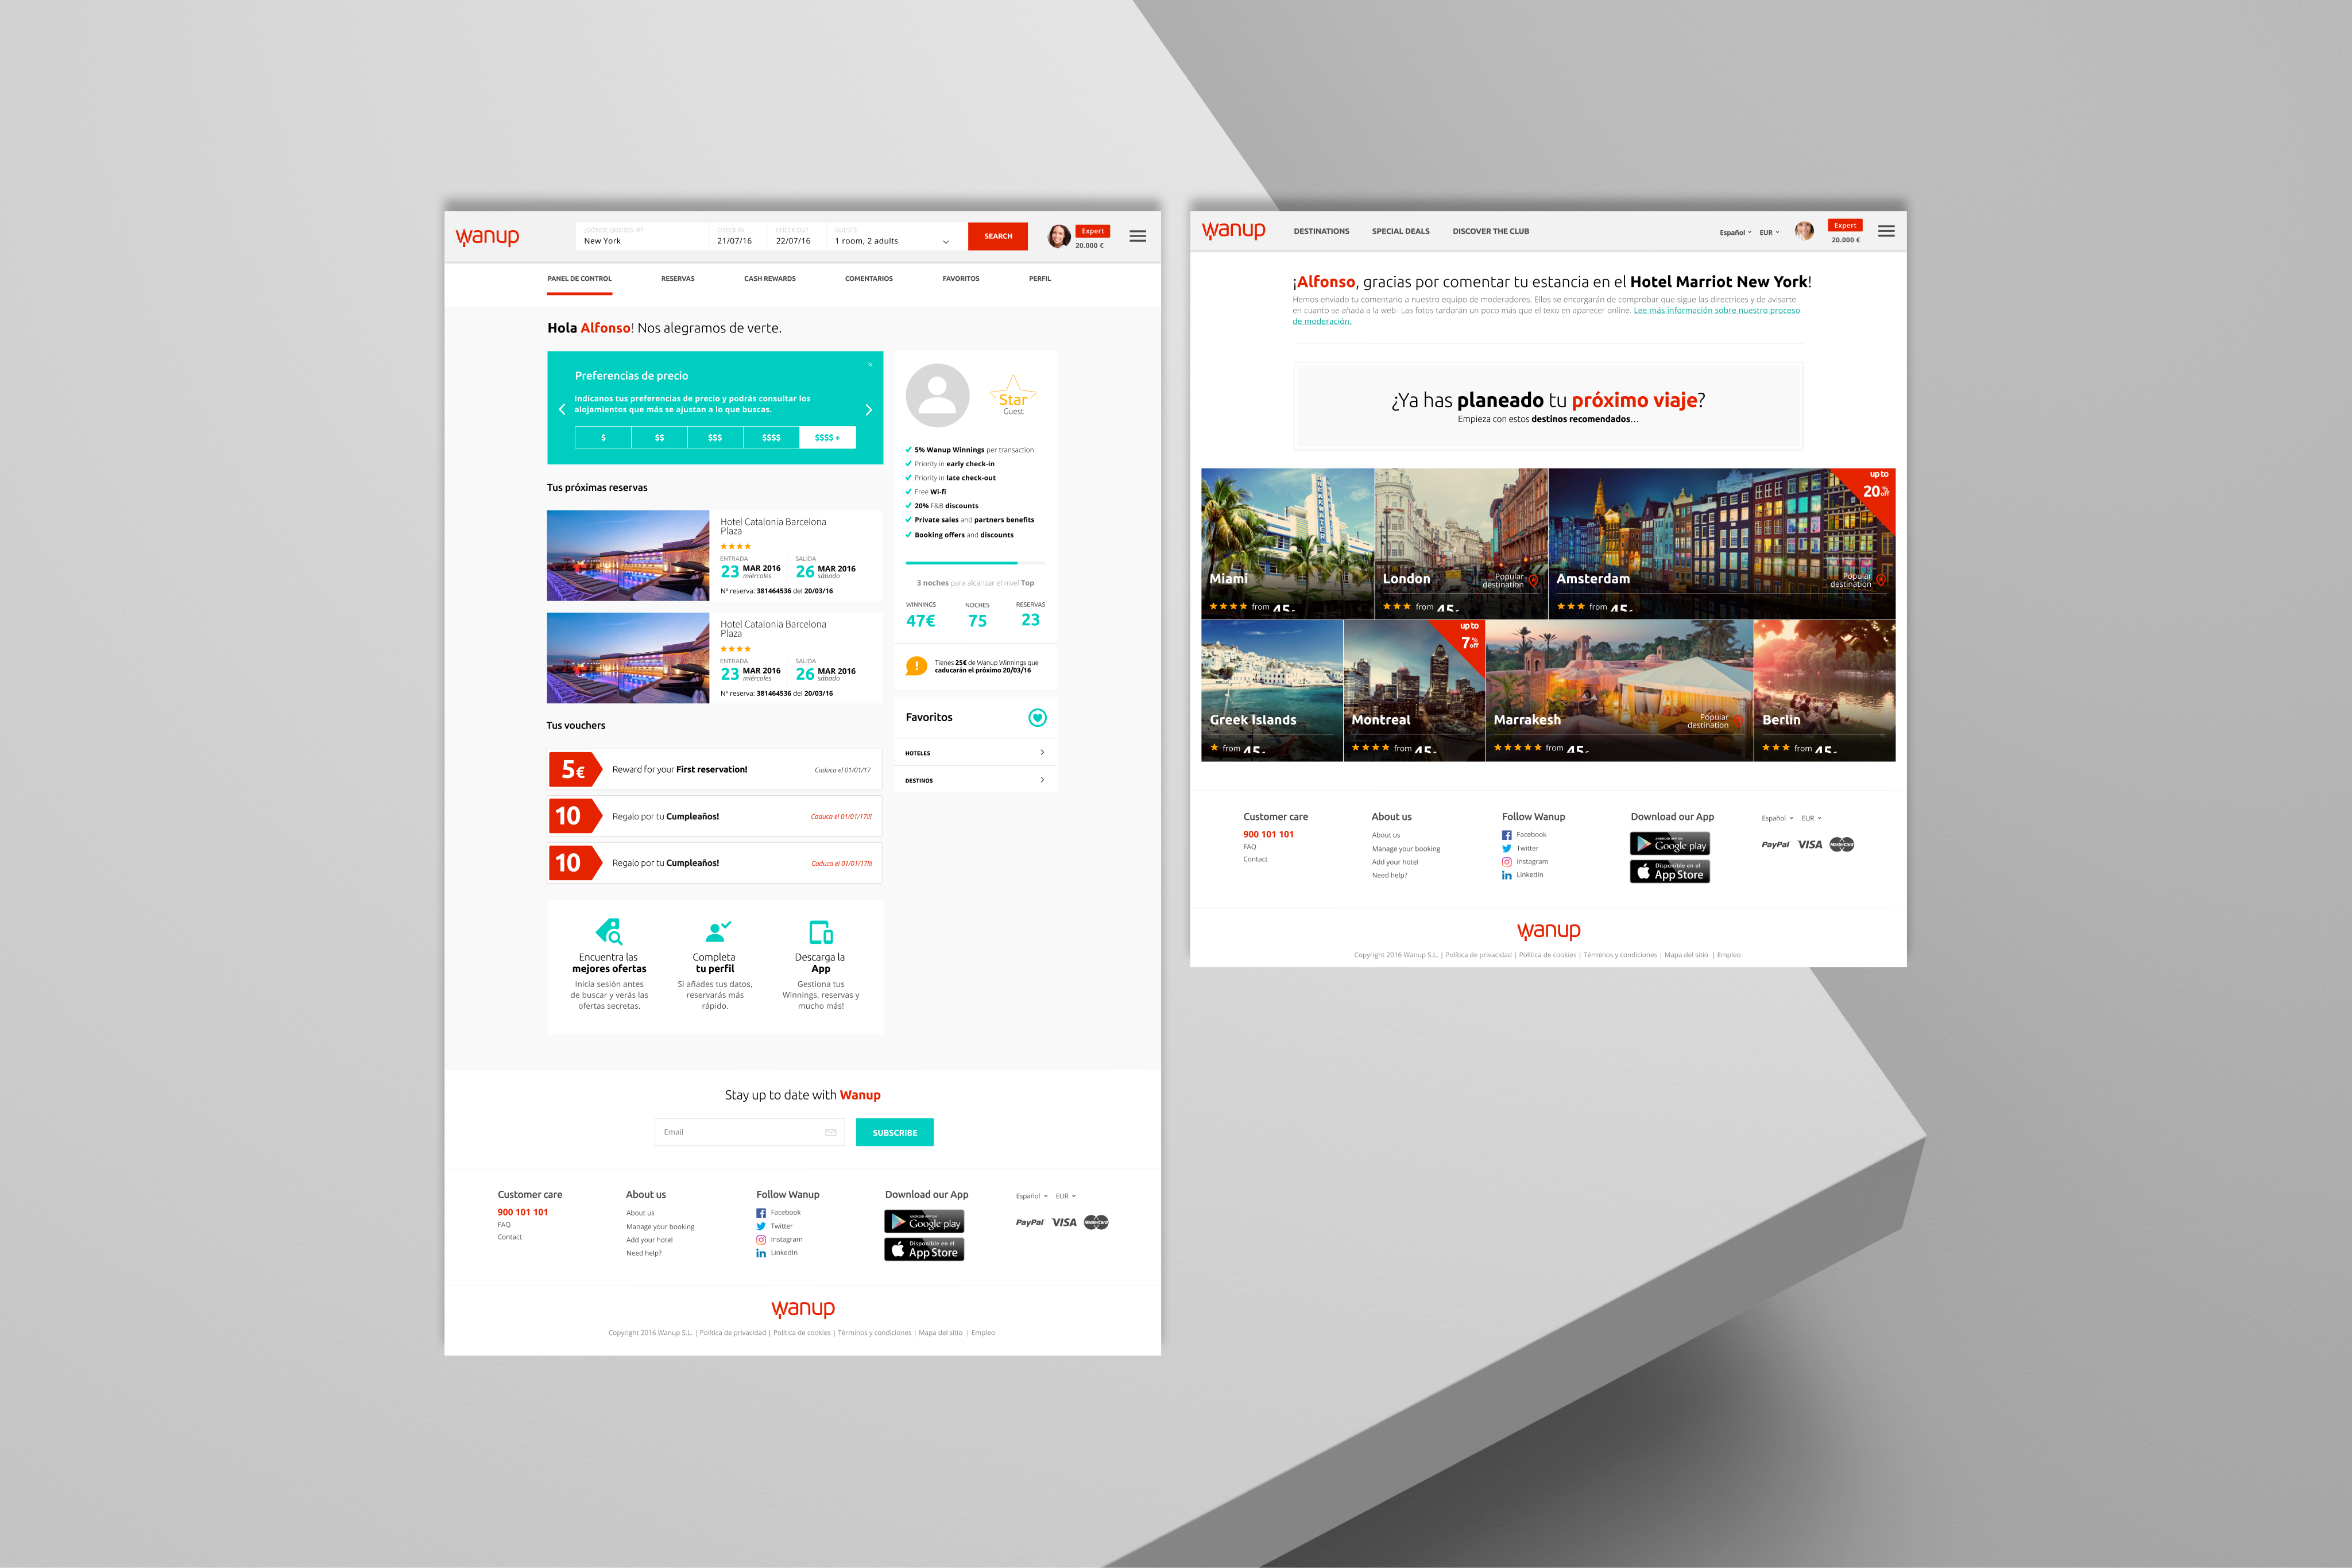
Final product across the core booking journey
Final product across the core booking journey: search results with redesigned hotel cards, the hotel detail page with trust signal hierarchy, and the stepped checkout with Wanup Rewards visible at confirmation.
Wanup case study additional screen
Search results with redesigned hotel cards and contextual filters — trust signals and pricing transparency visible before the user clicks through.
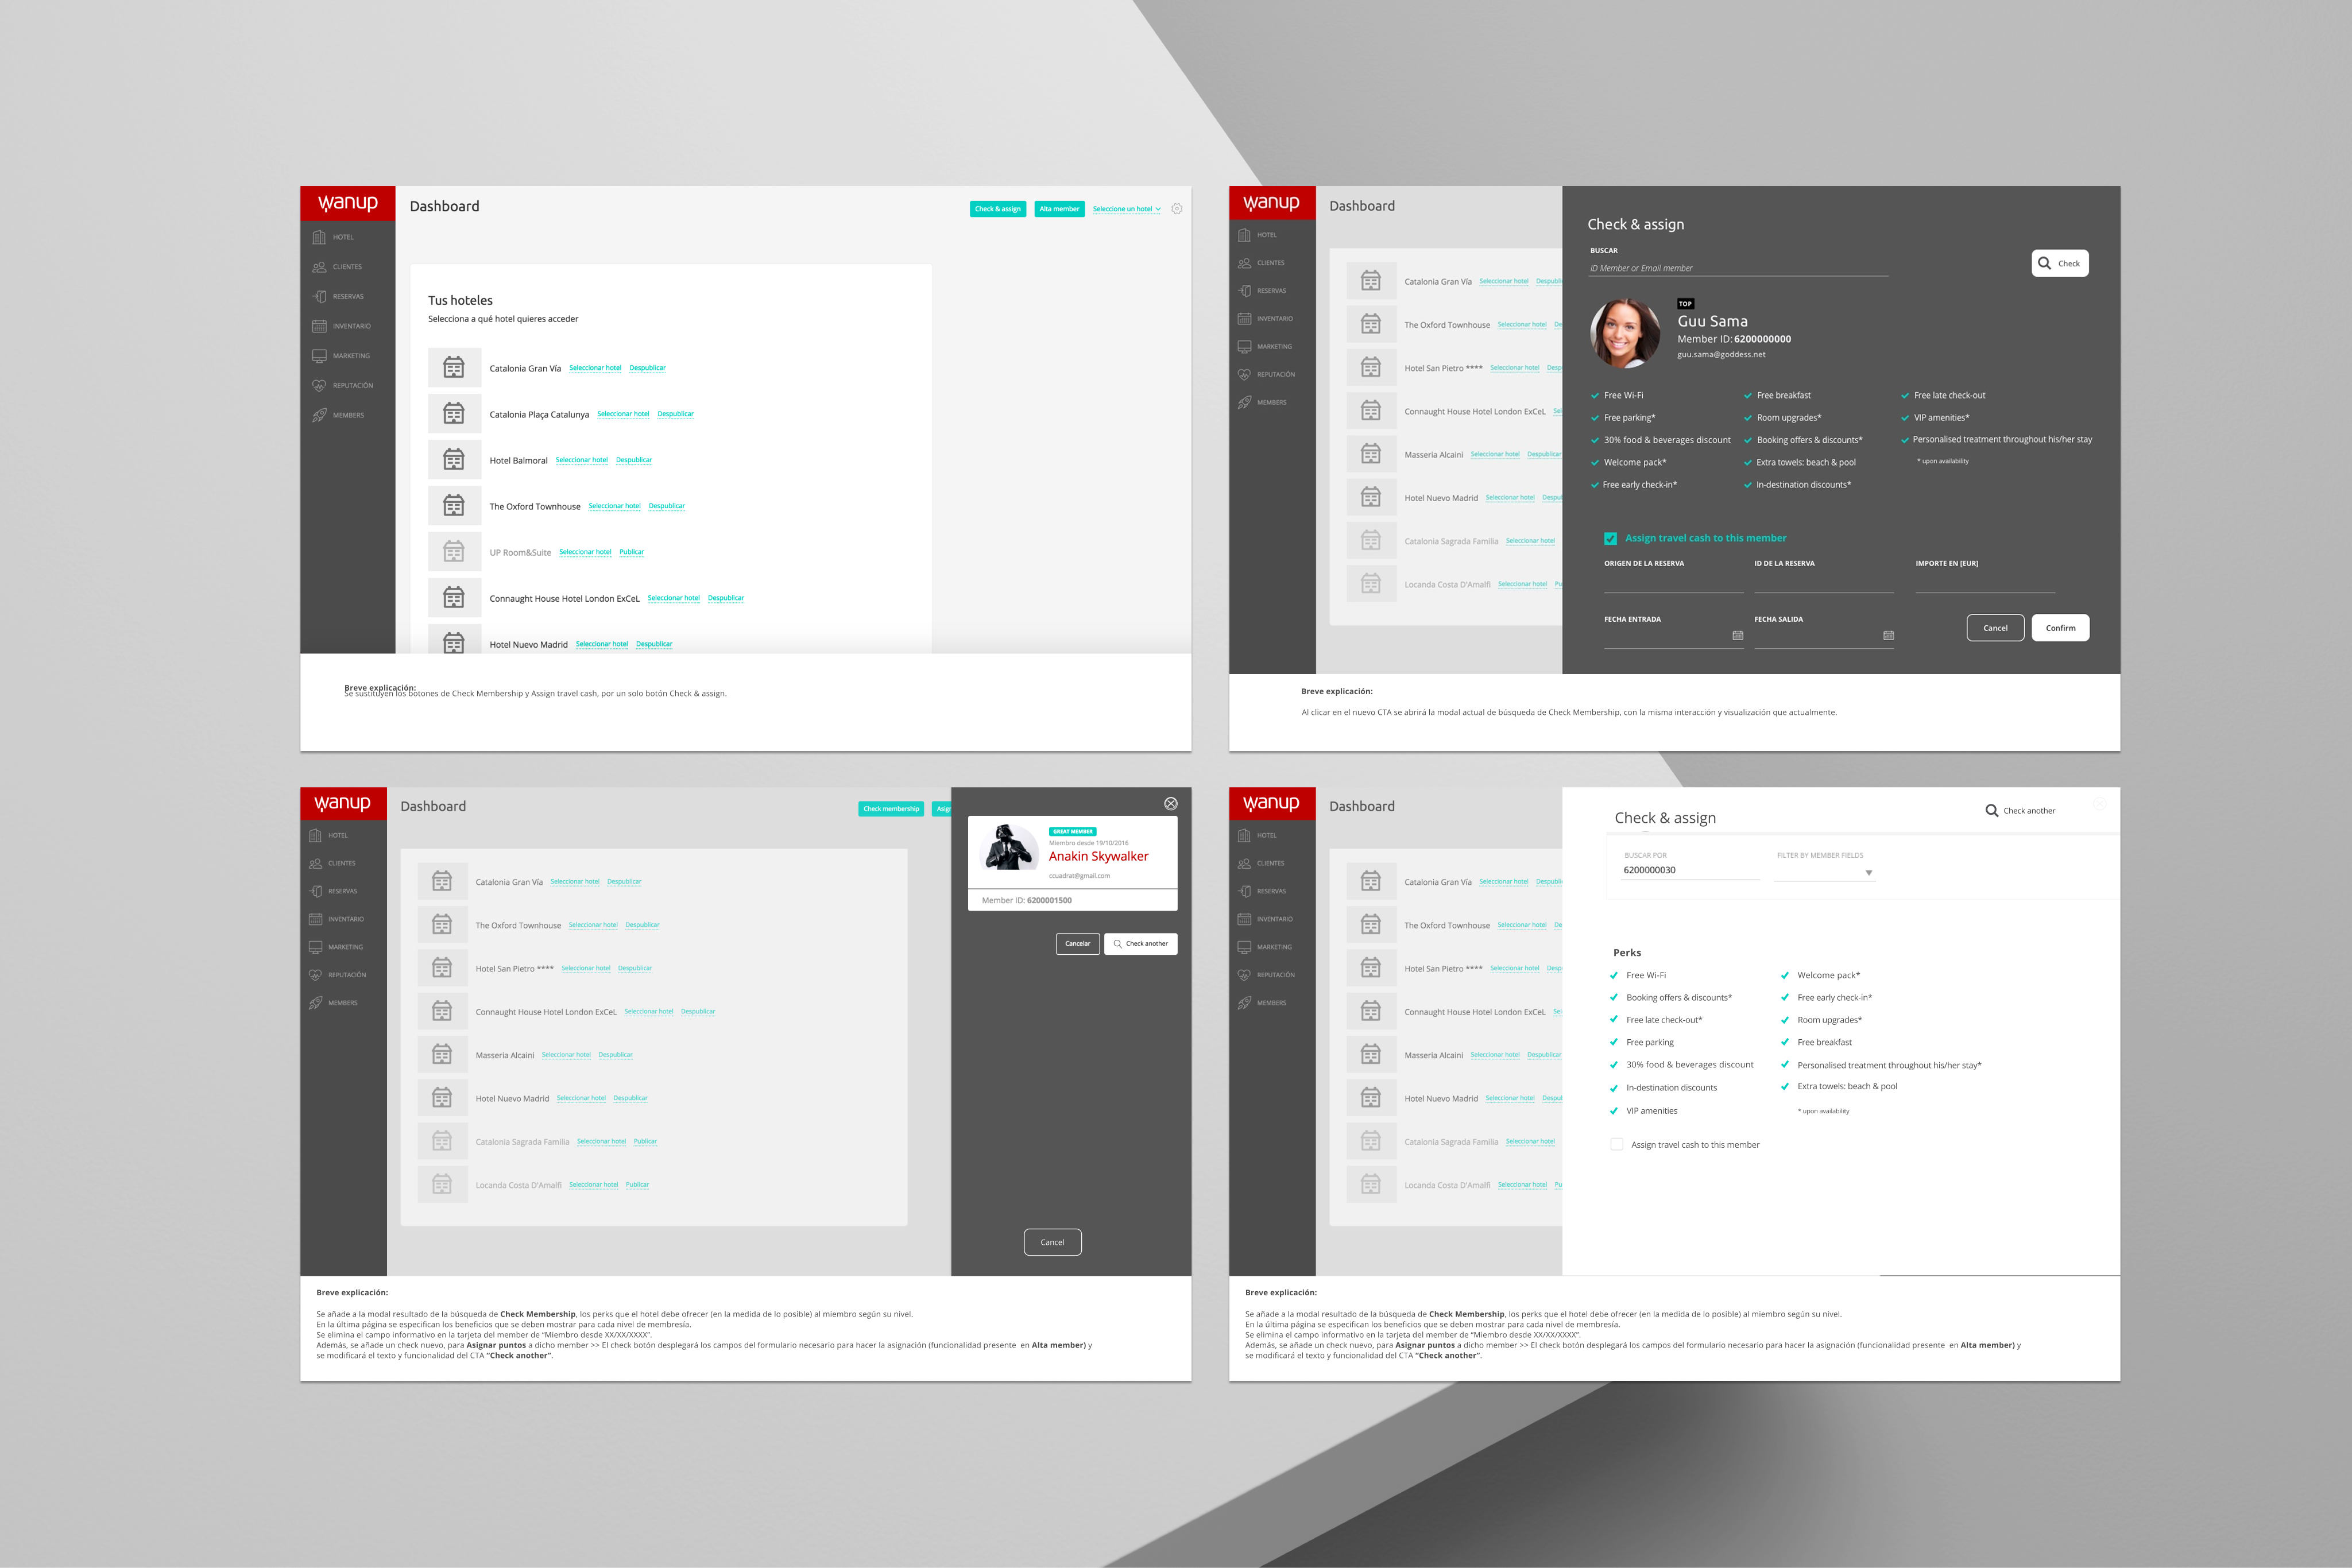
Wanup B2B hotel management tool
B2B management tool for hotel chains: inventory control, hosting configuration, and customer perks management — the hotelier-side interface built in parallel with the consumer booking experience.
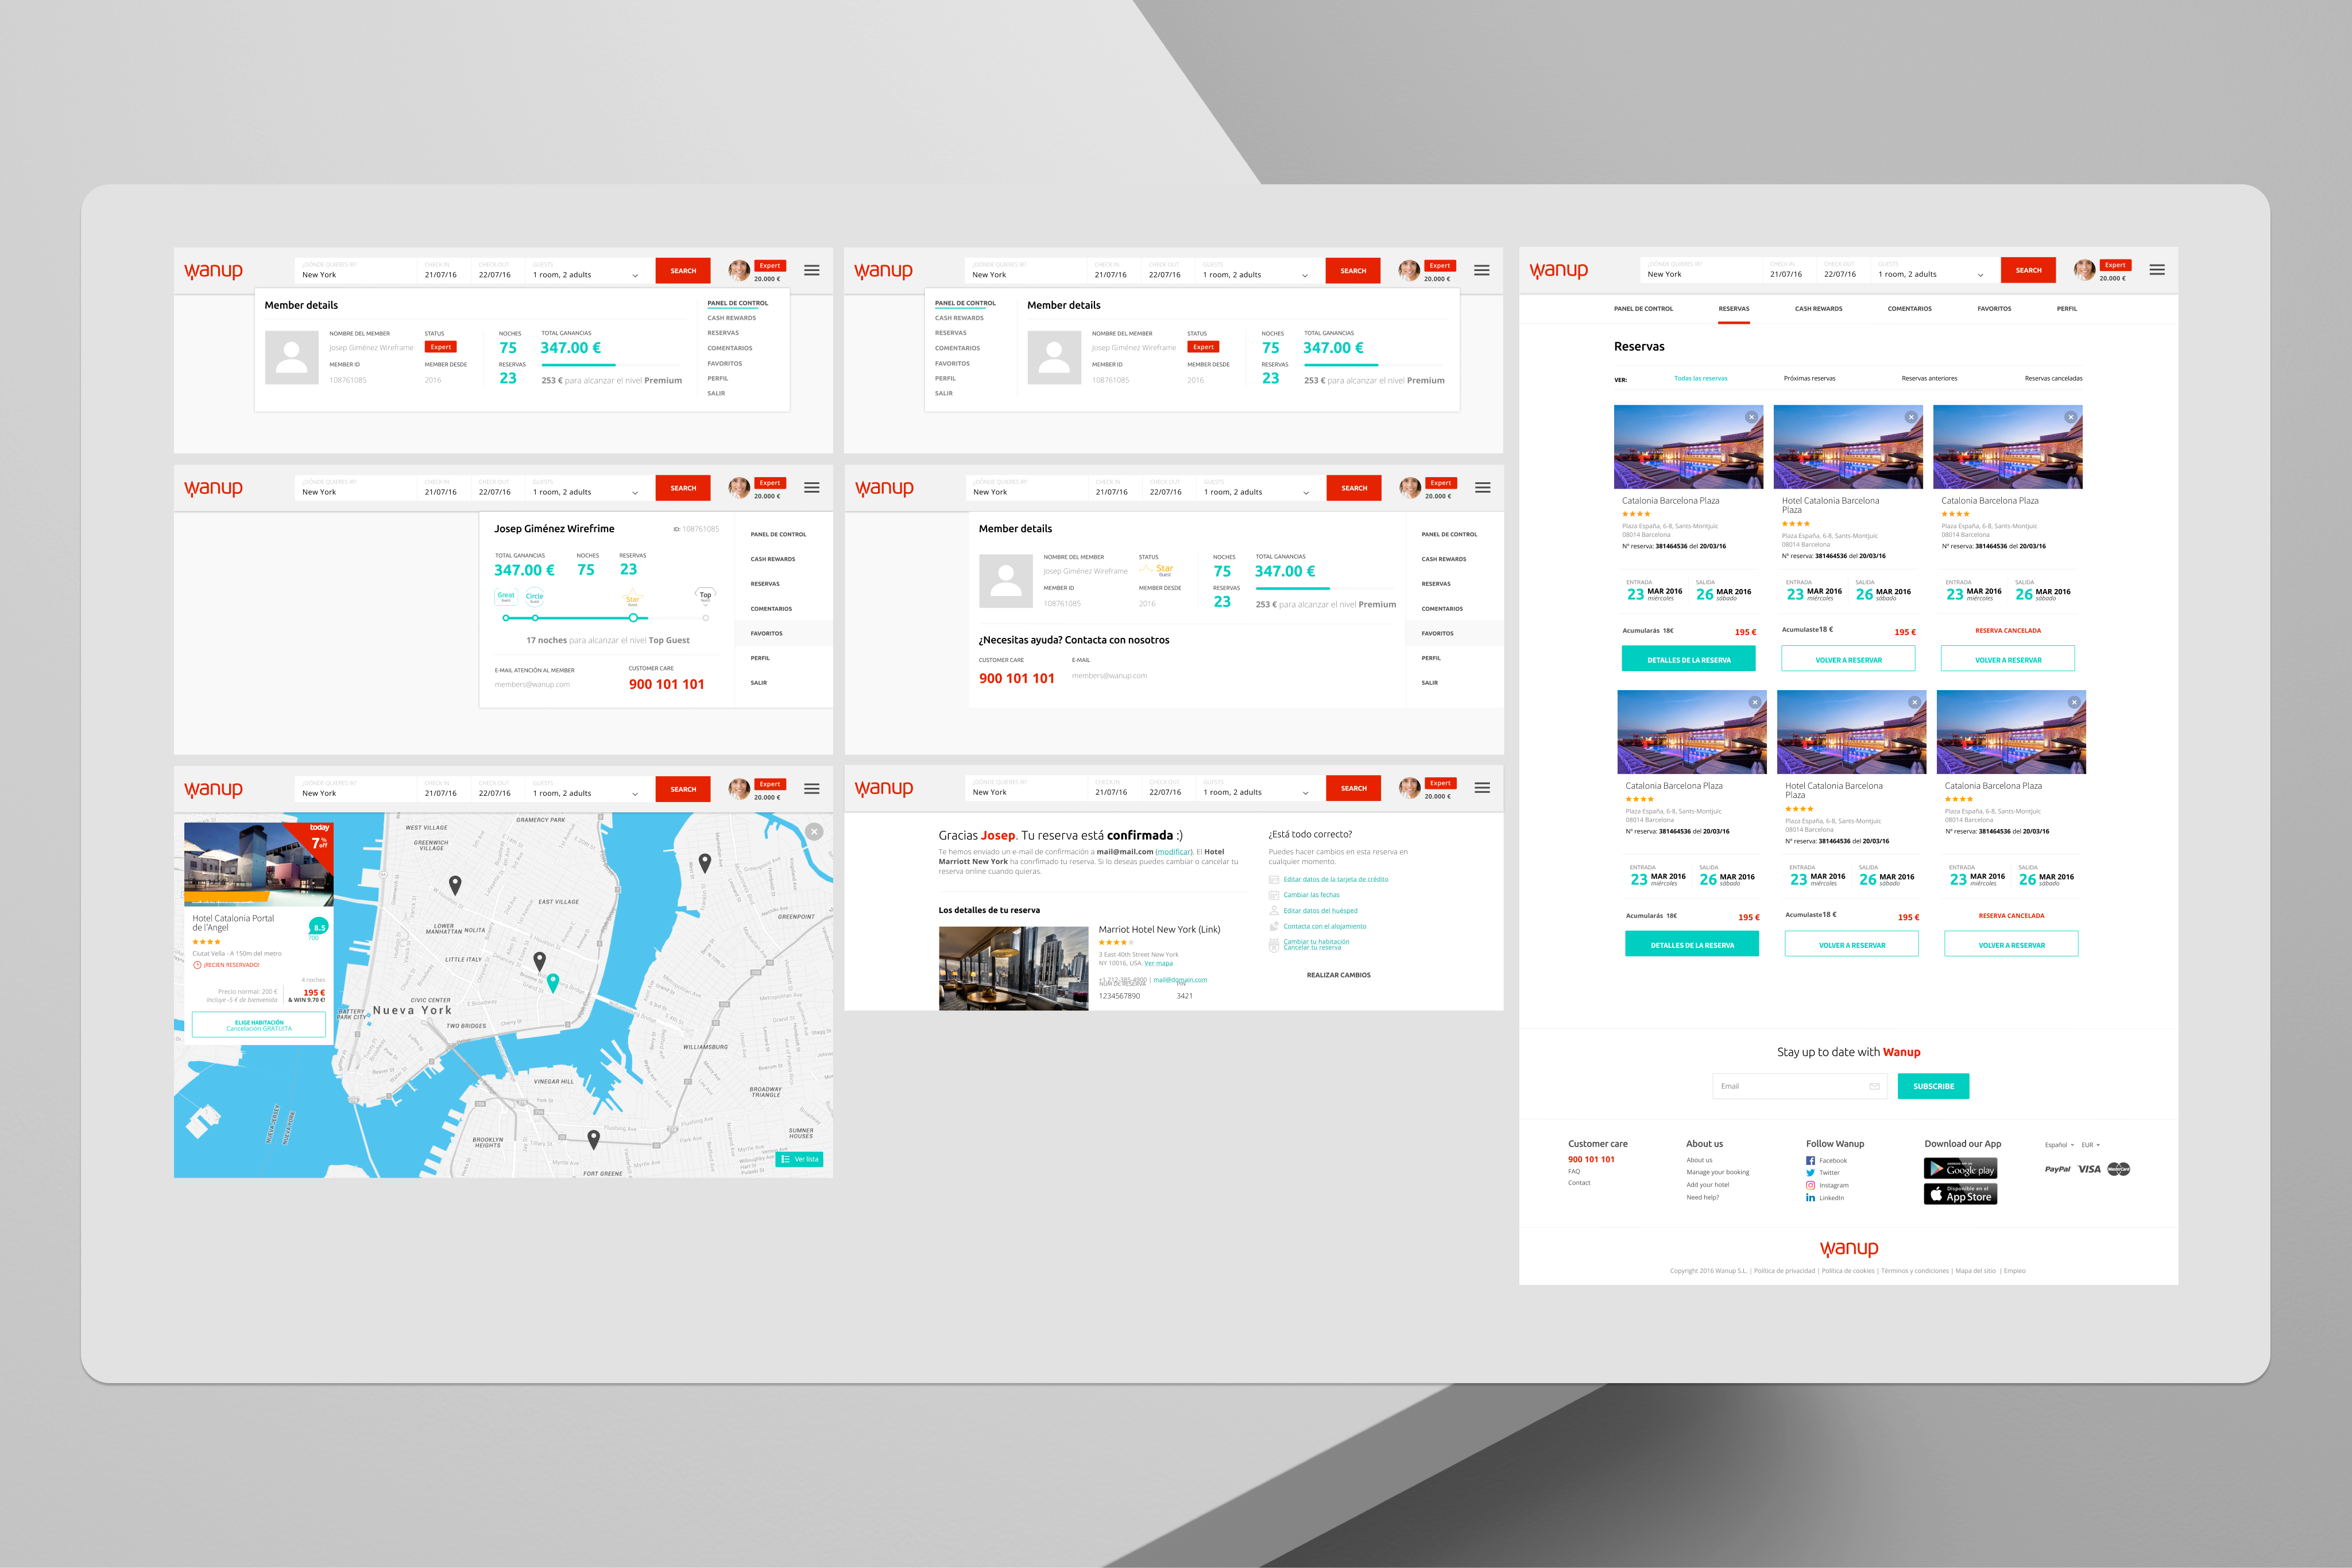
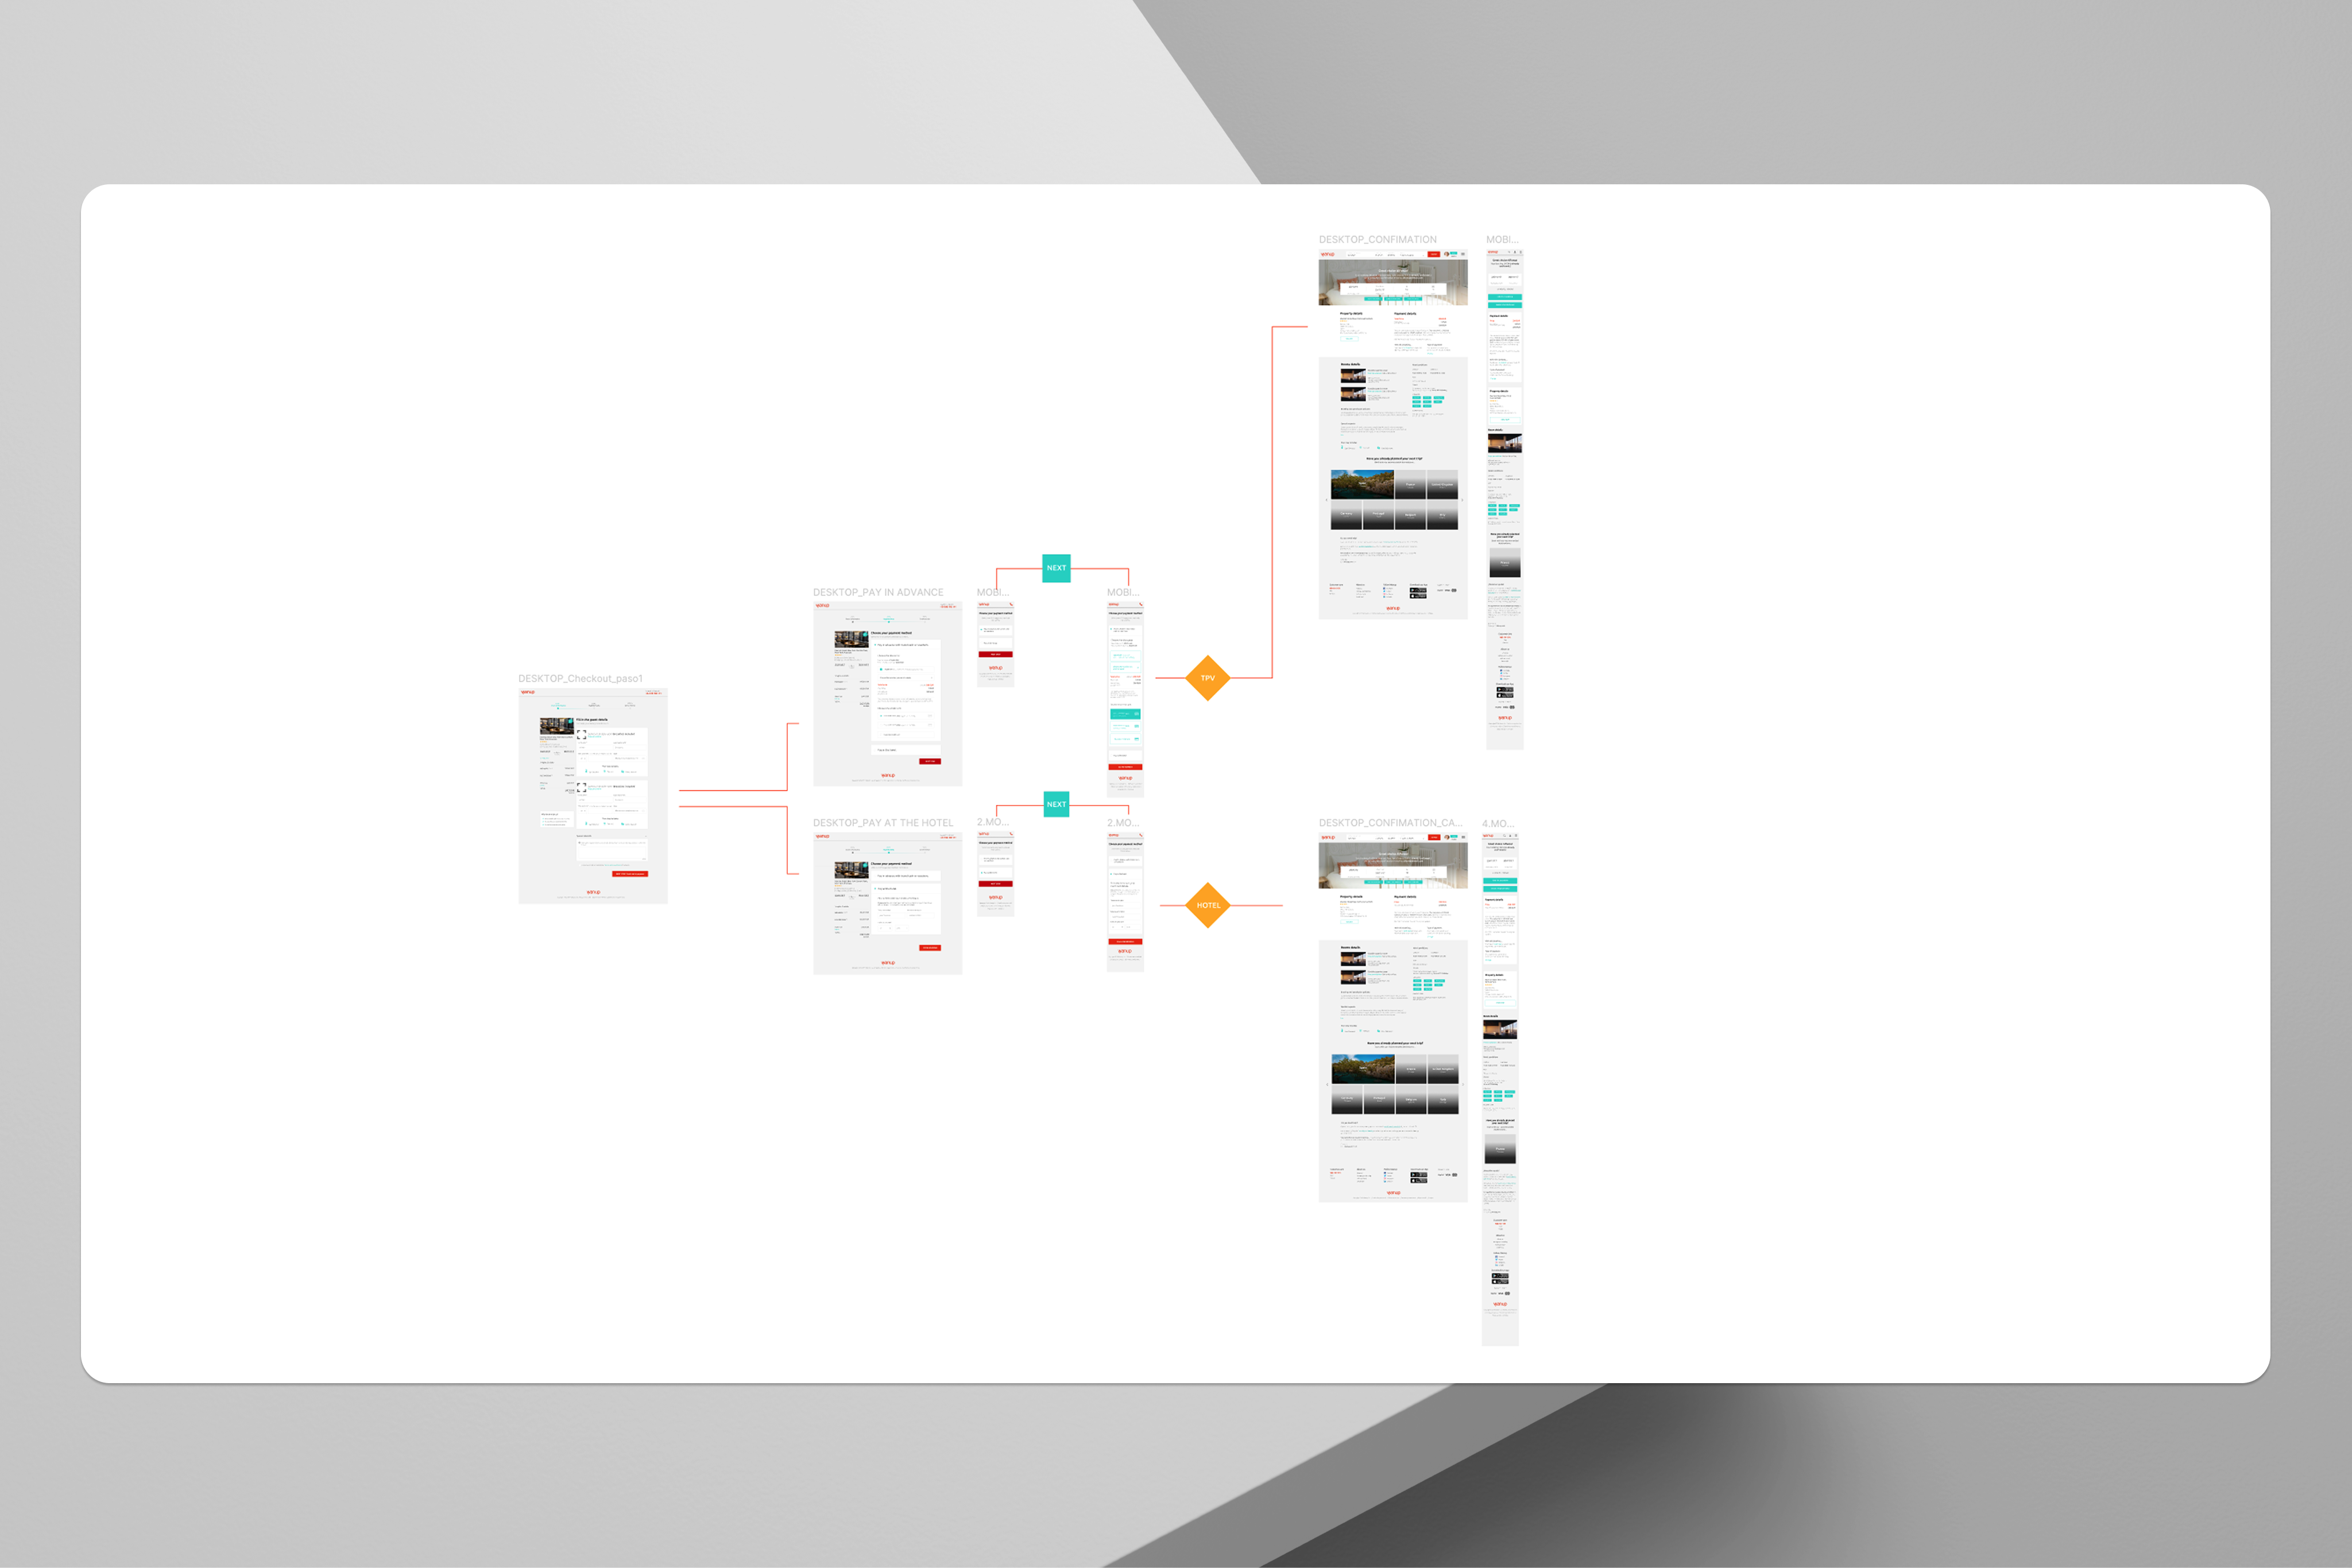
Wanup checkout flow and confirmation screen
Final checkout flow and confirmation screen — Wanup Rewards balance and next milestone visible at the moment of booking completion.

The repeat booking rate was the metric that mattered most, and the hardest to move. It required the entire architecture: the trust layer to get users to commit the first time, the loyalty layer to give them a reason to return, and the design system to make iteration fast enough to respond to what we learned post-launch.

08

What I'd do differently.

01

The hotelier side was underinvested from the start

We spent roughly 70% of research and design effort on the user-facing experience, and 30% on the hotelier management interface. In a two-sided marketplace, that imbalance has consequences. Hoteliers who found the management interface difficult to use updated their inventory less frequently, which hurt the quality of data available to users. In retrospect, I would have pushed for a more equal split from day one, and made the case with the funnel: better hotelier UX → better data quality → lower user abandonment.

02

The loyalty programme should have shaped the IA earlier

Wanup Rewards was scoped relatively late in the discovery phase, it entered the project after the initial IA was already defined. That meant we were retrofitting loyalty into a structure that wasn't designed for it. If I were starting again, I would have treated the loyalty layer as a first principle of the IA, not an additive layer on top of it. The rewards touchpoints we fought to include late in the project would have been natural if they'd been designed in from the start.

03

More time on the post-booking experience

The project naturally gravitated toward the pre-booking and booking flows, that's where the conversion problem lived. But repeat booking rate is driven by what happens after the first booking: the confirmation experience, the pre-stay communications, the post-stay feedback loop. We iterated on these, but with less rigour than the core flow. The 3.1× repeat rate tells me there was significant headroom we didn't reach.

Within 120 days, users who had never returned to Wanup started coming back. The loyalty layer gave them a reason to return, and the redesigned trust signals gave them the confidence to commit the first time.

3.1× repeat booking rate was the proof we'd solved the right problem. Not just a checkout. A relationship.

← All case studies